Using Infographic Chart Templates to Clarify Business Concepts
For professionals tasked with explaining complex data or multi-step processes, visual clarity is not just a bonus—it’s often a necessity. A Business Infographic Chart Template Set provides a structured starting point for this task. These are pre-designed collections of graphic elements—charts, diagrams, icons, and layouts—created in vector formats like EPS, SVG, and AI, which allow for extensive customization without loss of quality. The core purpose is to offer a universal, reusable framework for creating presentations, reports, brochures, or internal documents that are visually compelling and easy to understand.
What Distinguishes a Comprehensive Template Set
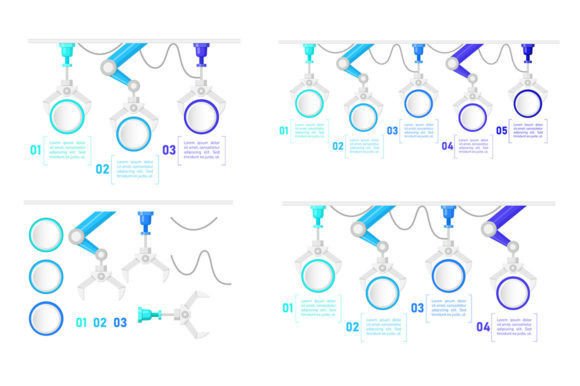
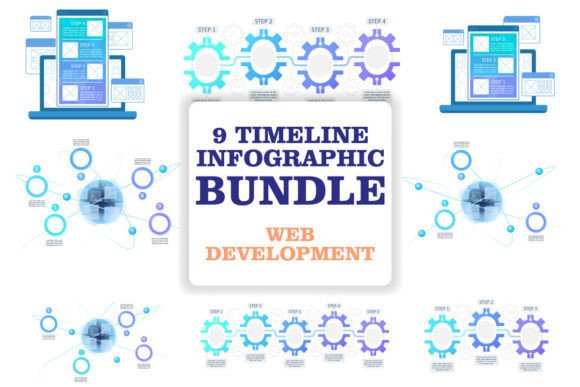
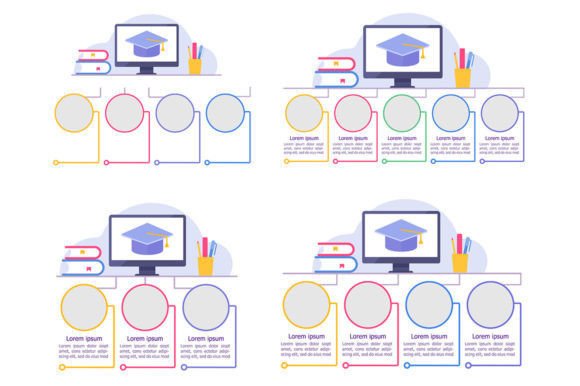
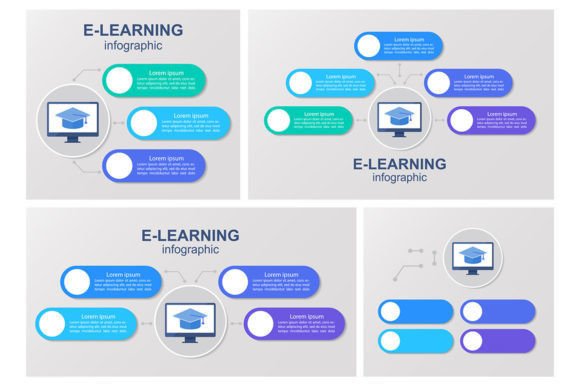
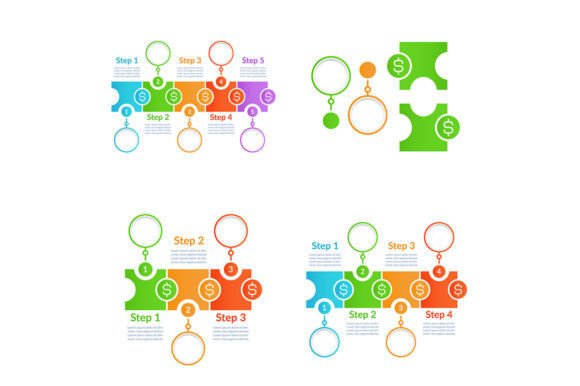
Many resources offer single infographic templates. A true Business Infographic Chart Template Set, however, is characterized by its systematic approach. It isn’t just one pie chart or one flowchart. It’s a coordinated library designed to work together. You’ll typically find instructional graphics with step sequences for explaining procedures, abstract vector info charts with blank copy spaces for inserting your specific data, and a variety of visual data presentation styles like bar graphs, timelines, and hierarchies. This coherence means you can maintain a consistent visual language across a whole project or suite of materials, which strengthens professional credibility and aids audience comprehension.
The inclusion of multiple file formats—EPS for print scalability, SVG for web use, PNG and JPEG for quick placement, and AI for deep Adobe Illustrator editing—is a critical feature. It speaks to versatility. A marketing team might use the PNGs to rapidly assemble a social media post, while a corporate strategist would use the editable AI files to build a detailed, brand-aligned investor report. This flexibility is a key differentiator from more rigid or single-format offerings.
Evaluating Your Options: Template Sets Versus Other Tools
When considering how to produce business infographics, you have several pathways. It’s useful to compare the template set approach with alternatives to understand its fit.
Standalone Design Software
Powerful tools like Adobe Illustrator or Canva offer blank canvases and primitive tools. Their strength is ultimate creative freedom. The tradeoff is the significant time and skill required to build every element from scratch. A Business Infographic Chart Template Set operates within these environments but provides the foundational architecture—the axes of a chart, the connectors in a flowchart, the placeholder text boxes. This drastically reduces the time from idea to finished visual, especially for users with intermediate design skills. It’s a hybrid solution: it doesn’t replace the software, but it augments its efficiency for business-specific tasks.
Marketplace Single Templates
Another common option is purchasing individual, one-off infographic templates for specific needs. This can be cost-effective for a single, urgent project. However, for organizations or individuals who regularly produce visual content, a cohesive set offers long-term value. The consistency in style and the breadth of chart types mean you’re not constantly searching for and adapting mismatched graphics, which can lead to a fragmented visual identity. The set is an investment in a reusable resource, whereas single templates are often a situational fix.
Fully Custom Agency Design
For high-stakes, brand-critical projects like a national campaign or a crucial investor deck, hiring a design agency is a valid choice. They provide completely bespoke artistry and strategic input. The limitation is obvious: cost and timeline. A customizable Business Infographic Chart Template Set sits in the middle ground. It grants a high degree of professional polish and adaptability without the premium agency fee. It is best suited for internal teams, freelancers, or small businesses that need to produce quality visuals regularly under their own direction and budget constraints.
Key Strengths and Practical Tradeoffs
Understanding the inherent advantages and compromises of using a template set will clarify its role in your toolkit.
Strengths: Efficiency and Coherence
The primary benefit is accelerated production. Instead of designing a grid system for a comparison chart or drawing icons for a process, you start with those elements already constructed and aligned. This efficiency is not just about speed; it reduces the cognitive load on the creator, allowing them to focus on the accuracy and impact of the content itself. Furthermore, using a unified set across departments—for example, sales using the same timeline style as HR for onboarding guides—builds a recognizable internal and external communication style.
Tradeoffs: Creative Constraints and Initial Adaptation
The natural tradeoff for this pre-built structure is some limitation on pure creative expression. While highly customizable in colors, fonts, and data, the underlying layouts and chart types are defined. For a designer seeking to create a never-seen-before infographic style, a template might feel restrictive. Additionally, there is an initial time investment required to learn the set’s structure, locate the relevant files in the package, and adapt them to your workflow. This upfront cost is usually offset by savings on subsequent projects, but it is a factor for someone with an immediate, one-time need.
Identifying the Best-Fit Situations
A Business Infographic Chart Template Set is not a universal solution, but it excels in specific scenarios.
- Regular Content Producers: Teams that publish weekly reports, create client presentations monthly, or update training manuals frequently find the reusable nature of a set invaluable.
- Brand Consistency Managers: Professionals responsible for ensuring all company materials adhere to visual standards use these sets as a governed starting point that everyone can use, minimizing style deviations.
- Subject Experts with Moderate Design Skills: A franchise consultant (as suggested by the prompt's thematic link) explaining a complex step sequence to potential franchisees benefits immensely. Their expertise is in the content; the template provides the polished visual vessel.
- Projects Requiring Rapid Iteration: When data is changing and a chart needs updating across multiple documents, having a master editable vector file makes revisions straightforward compared to rebuilding or altering static images.
When Another Option Might Be Necessary
It’s equally important to recognize when a different path might be preferable.
If your need is for a single, stunning, award-winning infographic for a flagship publication, the custom constraints of even the best template might not suffice. In that case, dedicated design talent, either internal or contracted, is the more appropriate resource. Similarly, if your data visualization requirements are highly technical or scientific—requiring specialized chart types not commonly found in business template sets (like ternary plots or complex network diagrams)—you may need to seek domain-specific tools or libraries.
Another consideration is software environment. While the mentioned set includes formats for major applications, some teams operate entirely within a niche or proprietary platform. If your workflow is locked into a system that cannot import EPS or SVG files, the utility of the set diminishes. Always verify format compatibility with your primary editing tools before committing.
Making an Informed Decision: Key Factors to Weigh
Choosing whether a Business Infographic Chart Template Set is right for you involves a few practical assessments.
- Frequency of Use: Will this be a resource you return to often, or is it for a one-off task? The value of a set compounds with reuse.
- Team Skill Level: Does your team have the basic competency to customize vectors in a program like Illustrator or a similar vector editor? If not, the learning curve might outweigh the benefits.
- Brand Control Needs: How important is absolute consistency across all your materials? Sets offer strong control; completely freeform design offers less.
- Content Type Balance: Analyze the set's components. Does it have a good mix of instructional graphics with step sequences for your processes, and abstract vector info charts with blank copy spaces for your data? Ensure it matches your typical content mix.
- Update and Expansion Policy: Some providers, as noted, offer new graphics every week or regular updates. For long-term users, this ongoing addition of fresh elements can be a significant advantage, keeping your visuals current without requiring a new purchase.
Ultimately, a high-quality Business Infographic Chart Template Set is a productivity amplifier for professional communication. It shifts the effort from building the visual framework to refining the meaningful content within it. By providing a universal, customizable, and coherent graphic foundation, it allows businesses, educators, and consultants to convey complex ideas—from franchise models to financial reports—with greater speed, consistency, and impact. For those who find their needs align with its strengths, it becomes a durable asset in the toolkit of modern information presentation.